Breaking News: US 2020 Presidential Election Forecasting Based on ABM Simulation
At 12PM (Beijing time) on November 1, 2020 (two days before the presidential election in United States), a research team at the Center for Complex Decision Analysis (directed by Prof. Shiping Tang), of Fudan University, Shanghai, China, releases their latest computer simulation-based predictions for the “relative shares of votes” in six states in the upcoming 59th American presidential election that is scheduled on November 3, 2020.
By “relative shares of votes”, we mean the share of votes by one party’s candidate divided by the total share of votes obtained by the two major parties (i.e., the Democratic Party and the Republic Party).
For these six states, our simulation has produced these forecasted results in early Sept. In fact, we have simulated three times: April, July, and then Sept. We have refrained from releasing our forecasting results to avoid affecting actual voting.
Our forecasting is based on agent-based modeling (ABM), with zero reliance on opinion polls. We have been developing this method since early 2015. For the releases of our earlier forecasting efforts, which have also been fairly accurate, please see the links at the end of this report (Appendix-II).
For 2020 U.S. election, our ABM-based forecasting primarily focuses on six states (due to the budget limit). It must be emphasized that our forecasting is a purely scientific exercise. The team has no intention of influencing actual elections in the U.S. by any means.
Obviously, the general public is more interested in the overall outcome of the election. We therefore also extend our forecasting to predict the final electoral college votes by combining our methods with polls projection (Appendix-I).
We appreciate the assistance “Intellisia Institute” provided in collecting part of the data.
Results of Our Forecasting
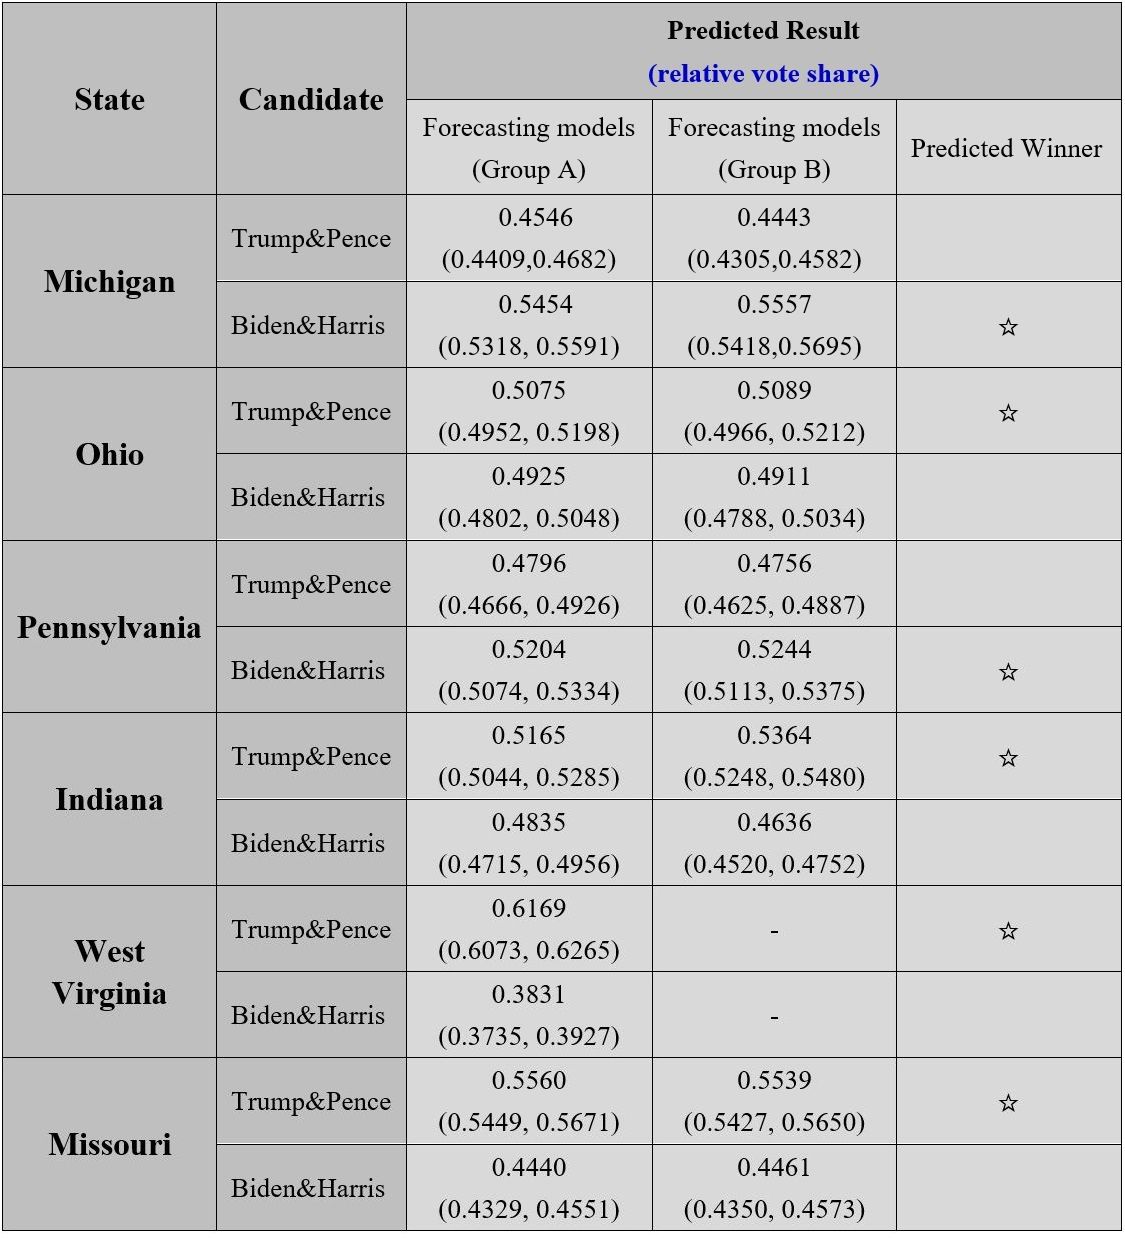
Note: A key difference between group A models and group B models is that among the various variables in our models, the former contains employment in which sector (agriculture, manufacturing, or others) whereas the latter replaces it with ethnic background.
1. Michigan
Our two sets of forecasting models predict that Biden&Harris will win the election with 54.54% or 55.57% of the popular votes in Michigan, on average. The first set of models (group A models) predict Biden&Harris will receive anywhere between 53.18% (lowest) and 55.91% (highest) of the total votes. The second set of models (group B models) predict that Biden&Harris will receive anywhere between 54.18% (lowest) and 56.95% (highest) of the total votes.
2. Ohio
Our two sets of forecasting models predict that Trump&Pence will win the election with 50.75% or 50.89% of the popular votes in Ohio, on average. The first set of models (group A models) predict Trump&Pence will receive anywhere between 49.52% (lowest) and 51.98% (highest) of the total votes. The second set of models (group B models) predict that Trump&Pence will receive anywhere between 49.66% (lowest) and 52.12% (highest) of the total votes.
3. Pennsylvania
Our two sets of forecasting models predict that Biden&Harris will win the election with 52.04% or 52.44% of the popular votes in Pennsylvania, on average. The first set of models (group A models) predict Biden&Harris will receive anywhere between 50.74% (lowest) and 53.34% (highest) of the total votes. The second set of models (group B models) predict that Biden&Harris will receive anywhere between 51.13% (lowest) and 53.75% (highest) of the total votes.
4. Indiana
Our two sets of forecasting models predict that Trump&Pence will win the election with 51.65% or 53.64% of the popular votes in Indiana, on average. The first set of models (group A models) predict Trump&Pence will receive anywhere between 50.44% (lowest) and 52.85% (highest) of the total votes. The second set of models (group B models) predict that Trump&Pence will receive anywhere between 52.48% (lowest) and 54.80% (highest) of the total votes.
5. West Virginia
For West Virginia, our simulation can only obtain one set of models (set A) due to the fact that ethnic diversity is low in the state. Our one set of forecasting models predicts that Trump&Pence will win the election with 61.69% of the popular votes in West Virginia, on average. The models predict Trump&Pence will receive anywhere between 60.73% (lowest) and 62.65% (highest) of the total votes.
6. Missouri
Our two sets of forecasting models predict that Trump&Pence will win the election with 55.60% or 55.39% of the popular votes, on average. The first set of models (group A models) predict Trump&Pence will receive anywhere between 54.49% (lowest) and 56.71% (highest) of the total votes. The second set of models (group B models) predict that Trump&Pence will receive anywhere between 54.27% (lowest) and 56.50 %(highest) of the total votes.
Summary
Our forecasting is the outcome of a yearlong project conducted by Tang’s team at Fudan University in Shanghai. It follows our team’s accurate forecasting of the Taiwanese presidential election in 2016, the mid-term US Senate elections in West Virginia and Missouri in 2018, the mayoral elections of Taipei, New Taipei and Taoyuan in Taiwan in 2018, and the Taiwan 2020 general election. For more information, please visit our official website:
www.ccda.fudan.edu.cn
In the process of simulation, the team strives to (1) conduct variable selection and model construction under the guidance of election theories in political science; (2) combine individual-level data of voters and candidates with structural-level data of economic and social development; (3) combine long-term steady effects and short-term fluctuation effects, in an attempt to forecast the election more accurately through standardized models, rigorous procedures, and computational algorithm. By introducing ABM simulation, this research represents a meaningful attempt in exploring a new scientific method of election forecasting.
The method developed by Tang and his colleagues circumvents the need of relying on polling data. In other words, our ABM-based forecasts do not have any input from public opinion polls. As a result, our ABM-based method can still deliver (potentially) accurate predictions, even in places where poll data is scarce or poor in quality. More importantly, our method does not merely predict which candidate is going to win or lose, but their share of votes within a predictive interval dictated by their baseline models.
We are now drafting a full paper that will provide more technical details about our approach.
Appendix-I: Forecasting the Overall Election Outcome
Because the general public is far more interested in the overall outcome of the presidential election than the percentage of votes obtained by candidates in specific states, we also release our extended forecasting for the overall outcome.
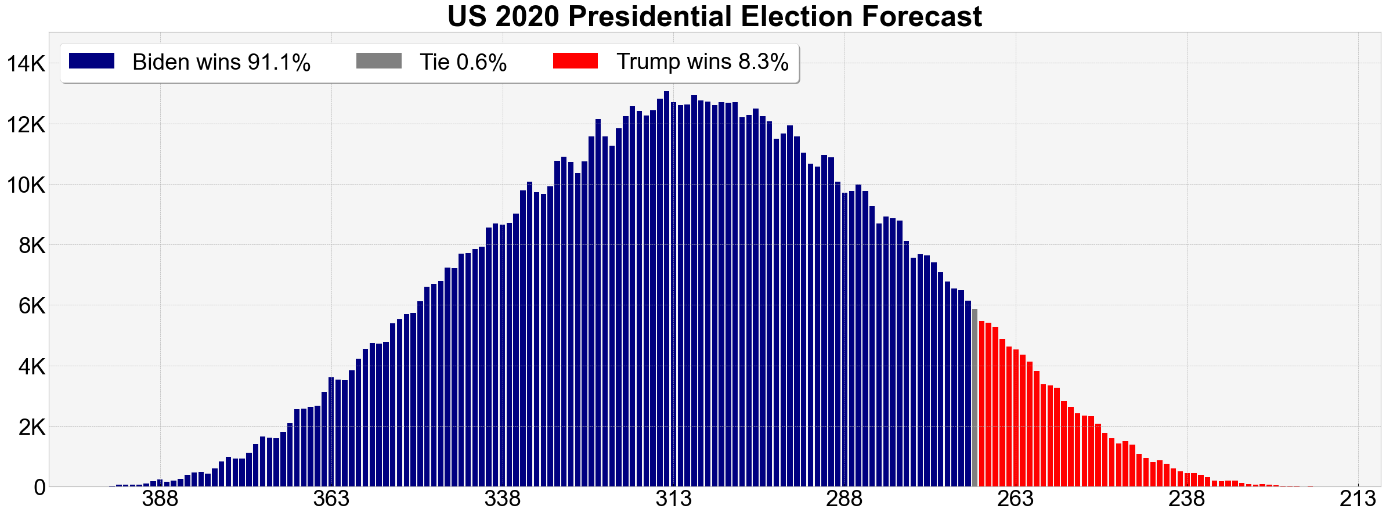
What needs to be emphasized here is that for this part of forecasting, we can only rely on polls obtained by polling houses or agencies, except for the ABM-based forecasted results in the six states we have shown above. What we do is then to use Monte Carlo simulation to simulate the possible scenarios for one candidate to cross the threshold of 270 electoral college votes that means an electoral win.
Our simulations produce these following results: Biden&Harris has a probability of 89.6% to 92.4% (91.1% on average) for winning the presidential election, and Trump&Pence has a probability of 7.1% to 9.6% (8.3% on average) for winning the presidential election. Of course, although our forecasting shows that Trump's re-election probability is very low, this does not mean that the probability of Trump being re-elected is zero.
You can download PDF version of this report from here:
English Version: download PDF version
Chinese Version: 点击下载PDF版本
Appendix-II: Earlier Releases of Our Previous Forecasting Efforts
(1) Four years ago, on Jan. 05, 2016 (Chinese version) and Jan. 10, 2016 (English version), that is, before the election in Taiwan was started that year, Tang’s team released our forecasting of this election. That prediction was our first attempt of election forecasting with our new approach. For details, see:
Chinese Version:
http://www.ccda.fudan.edu.cn/index.php?c=article&id=75
English Version:
https://china.ucsd.edu/_files/01112016_Taiwan-election.pdf;
https://chinafocus.ucsd.edu/2016/01/10/taiwan-election-results-predicted-in-computer-simulation/
(2) On Nov. 04, 2018, our team released our forecasting of US Senate Elections in two states (West Virginia and Missouri) before the actual voting of the two elections. That forecasting was our second attempt of election forecasting with our new approach. For details, see:
Chinese Version:
http://blog.sina.com.cn/s/blog_744a73490102y7bd.html
http://www.ccda.fudan.edu.cn/index.php?c=article&id=80
English Version:
http://www.ccda.fudan.edu.cn/index.php?c=article&id=81
https://www.linkedin.com/pulse/united-states-senate-elections-west-virginia-missouri-tang-dr/?trackingId=shAzPfa2GP9KRu%2BbwvnIyQ%3D%3D
Results compared:
Chinese Version: https://sirpa.fudan.edu.cn/info/1079/2741.htm
Brief English version:
https://www.linkedin.com/pulse/prelimary-assessment-our-forecasting-excellent-perhaps-tang-dr/
(3) On Nov. 22, 2018, our team released the forecasting of Taiwan local elections (Taipei, New Taipei, and Taoyuan) before the elections were started that year. That prediction was our third attempt of election forecasting with our new approach. For details, see:
Chinese Version:
http://www.ccda.fudan.edu.cn/index.php?c=article&id=83
English Version:
http://www.ccda.fudan.edu.cn/index.php?c=article&id=84
Results compared:
Chinese Version:
http://www.ccda.fudan.edu.cn/index.php?c=article&id=85
(4) On January 9, 2020, our team released the forecasted results for the Taiwan general election on January 11, 2020. That prediction was our fourth attempt of election forecasting with our new approach. For English version link, see:
https://www.linkedin.com/pulse/2020-taiwan-elections-forecasted-computer-simulation-shiping-tang-dr/
For our initial assessment of this forecasting experiment, see:
English Version: http://www.ccda.fudan.edu.cn/index.php?c=article&id=97
Chinese Version: http://www.ccda.fudan.edu.cn/index.php?c=article&id=96